“One bad measurement” ruled out as Hubble tension explanation
The distance ladder and the CMB give incompatible values for the expansion rate. A new study shows just how robust the Hubble tension is.

This graphic represents the tension that exists between measurements of the expansion rate of the late, nearby Universe, versus what would be expected based on measurements of the early Universe. These two approaches are expected to yield the same result, but they don’t. This discrepancy is known as the Hubble tension, and is represented in this graphic by the misalignment between the Early Route and Late Route bridges, yielding incompatible values for the expansion rate of 67 km/s/Mpc and 73 km/s/Mpc, with an error of 1% or less on each one.
Credit: NOIRLab/NSF/AURA/J. da Silva/J. Pollard
- For the past 15 years, two fundamentally different ways of measuring the expansion rate of the Universe, either through an early relic signal or a distance ladder method, have given incompatible results.
- Relics imprinted in the CMB and the large-scale structure of the Universe give a value for the expansion rate of 67 km/s/Mpc, while the distance ladder yields 73 km/s/Mpc, with uncertainties small enough that this now has hit 7-sigma significance.
- Many keep hoping that an error in the distance ladder will bring things back into line, but a new, comprehensive analysis all but kills the hope for that type of resolution. Here’s why.
For 15 years now, the expanding Universe hasn’t added up.

This graph shows a comparison between the value of H0, or the expansion rate today, as derived from Hubble Space Telescope Cepheids and anchors as well as other subsamples of JWST Cepheids (or other types of stars) and anchors. A comparison to Planck, which uses the early relic method instead of the distance ladder method, is also shown. Very clearly, the distance ladder and early relic methods do not yield mutually compatible results.
Different measurement methods should converge on the same answer.
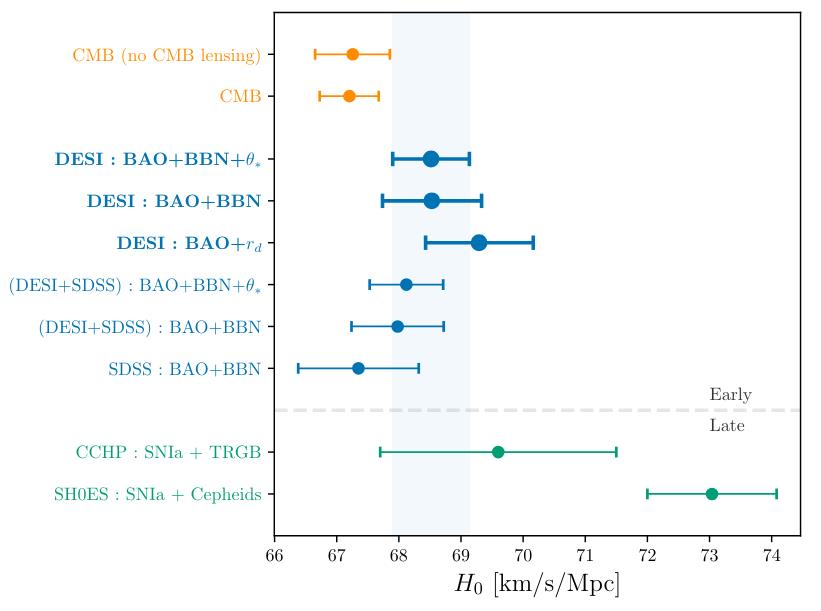
A large class of early relic methods, involving either the CMB and/or BAO (with a specific focus on DESI publications), all favor a Universe expanding at ~67 km/s/Mpc. Although there are a few groups that have outlier values for distance ladder measurements (including the CCHP group, shown as the second-from-bottom point), the strongest measurements, from the SH0ES and Pantheon+ collaborations, for instance, favor a value of ~73 km/s/Mpc, as shown here with smaller error bars. The two sets of values disagree at more than 5-sigma significance.
But “early relic” and “distance ladder” results for the expansion rate significantly disagree.
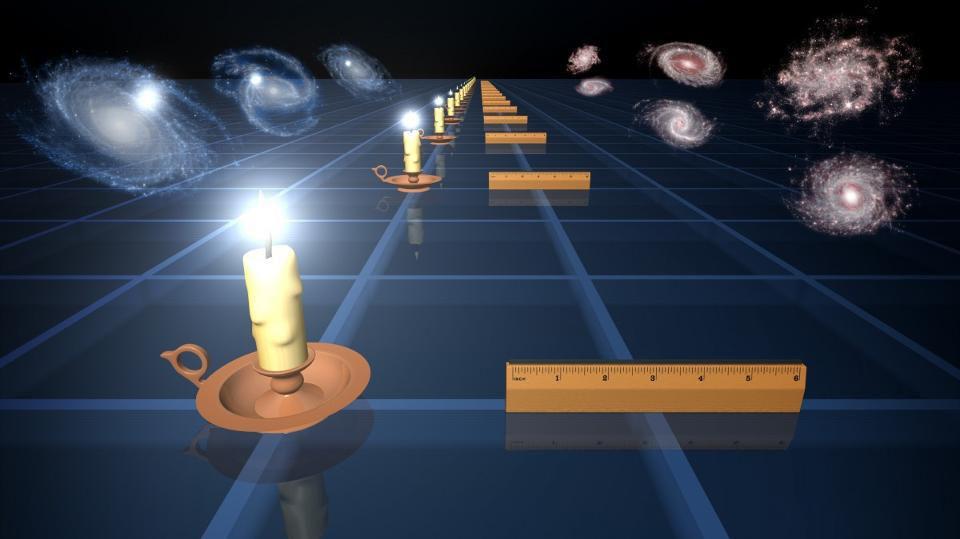
Standard candles (left) and standard rulers (right) are two different techniques astronomers used to measure the expansion of space at various times/distances in the past. Based on how quantities like luminosity or angular size change with distance, we can infer the expansion history of the Universe. Standard candles involve looking at objects whose intrinsic brightness is known at all cosmic distances, while standard rulers involve looking at features such as the average separation distance between any two galaxies (imprinted from baryon acoustic oscillations during the early stages of the Big Bang) that evolve as the Universe expands.
The early relic method — tracking baryon acoustic oscillation imprints — produces 67 km/s/Mpc.
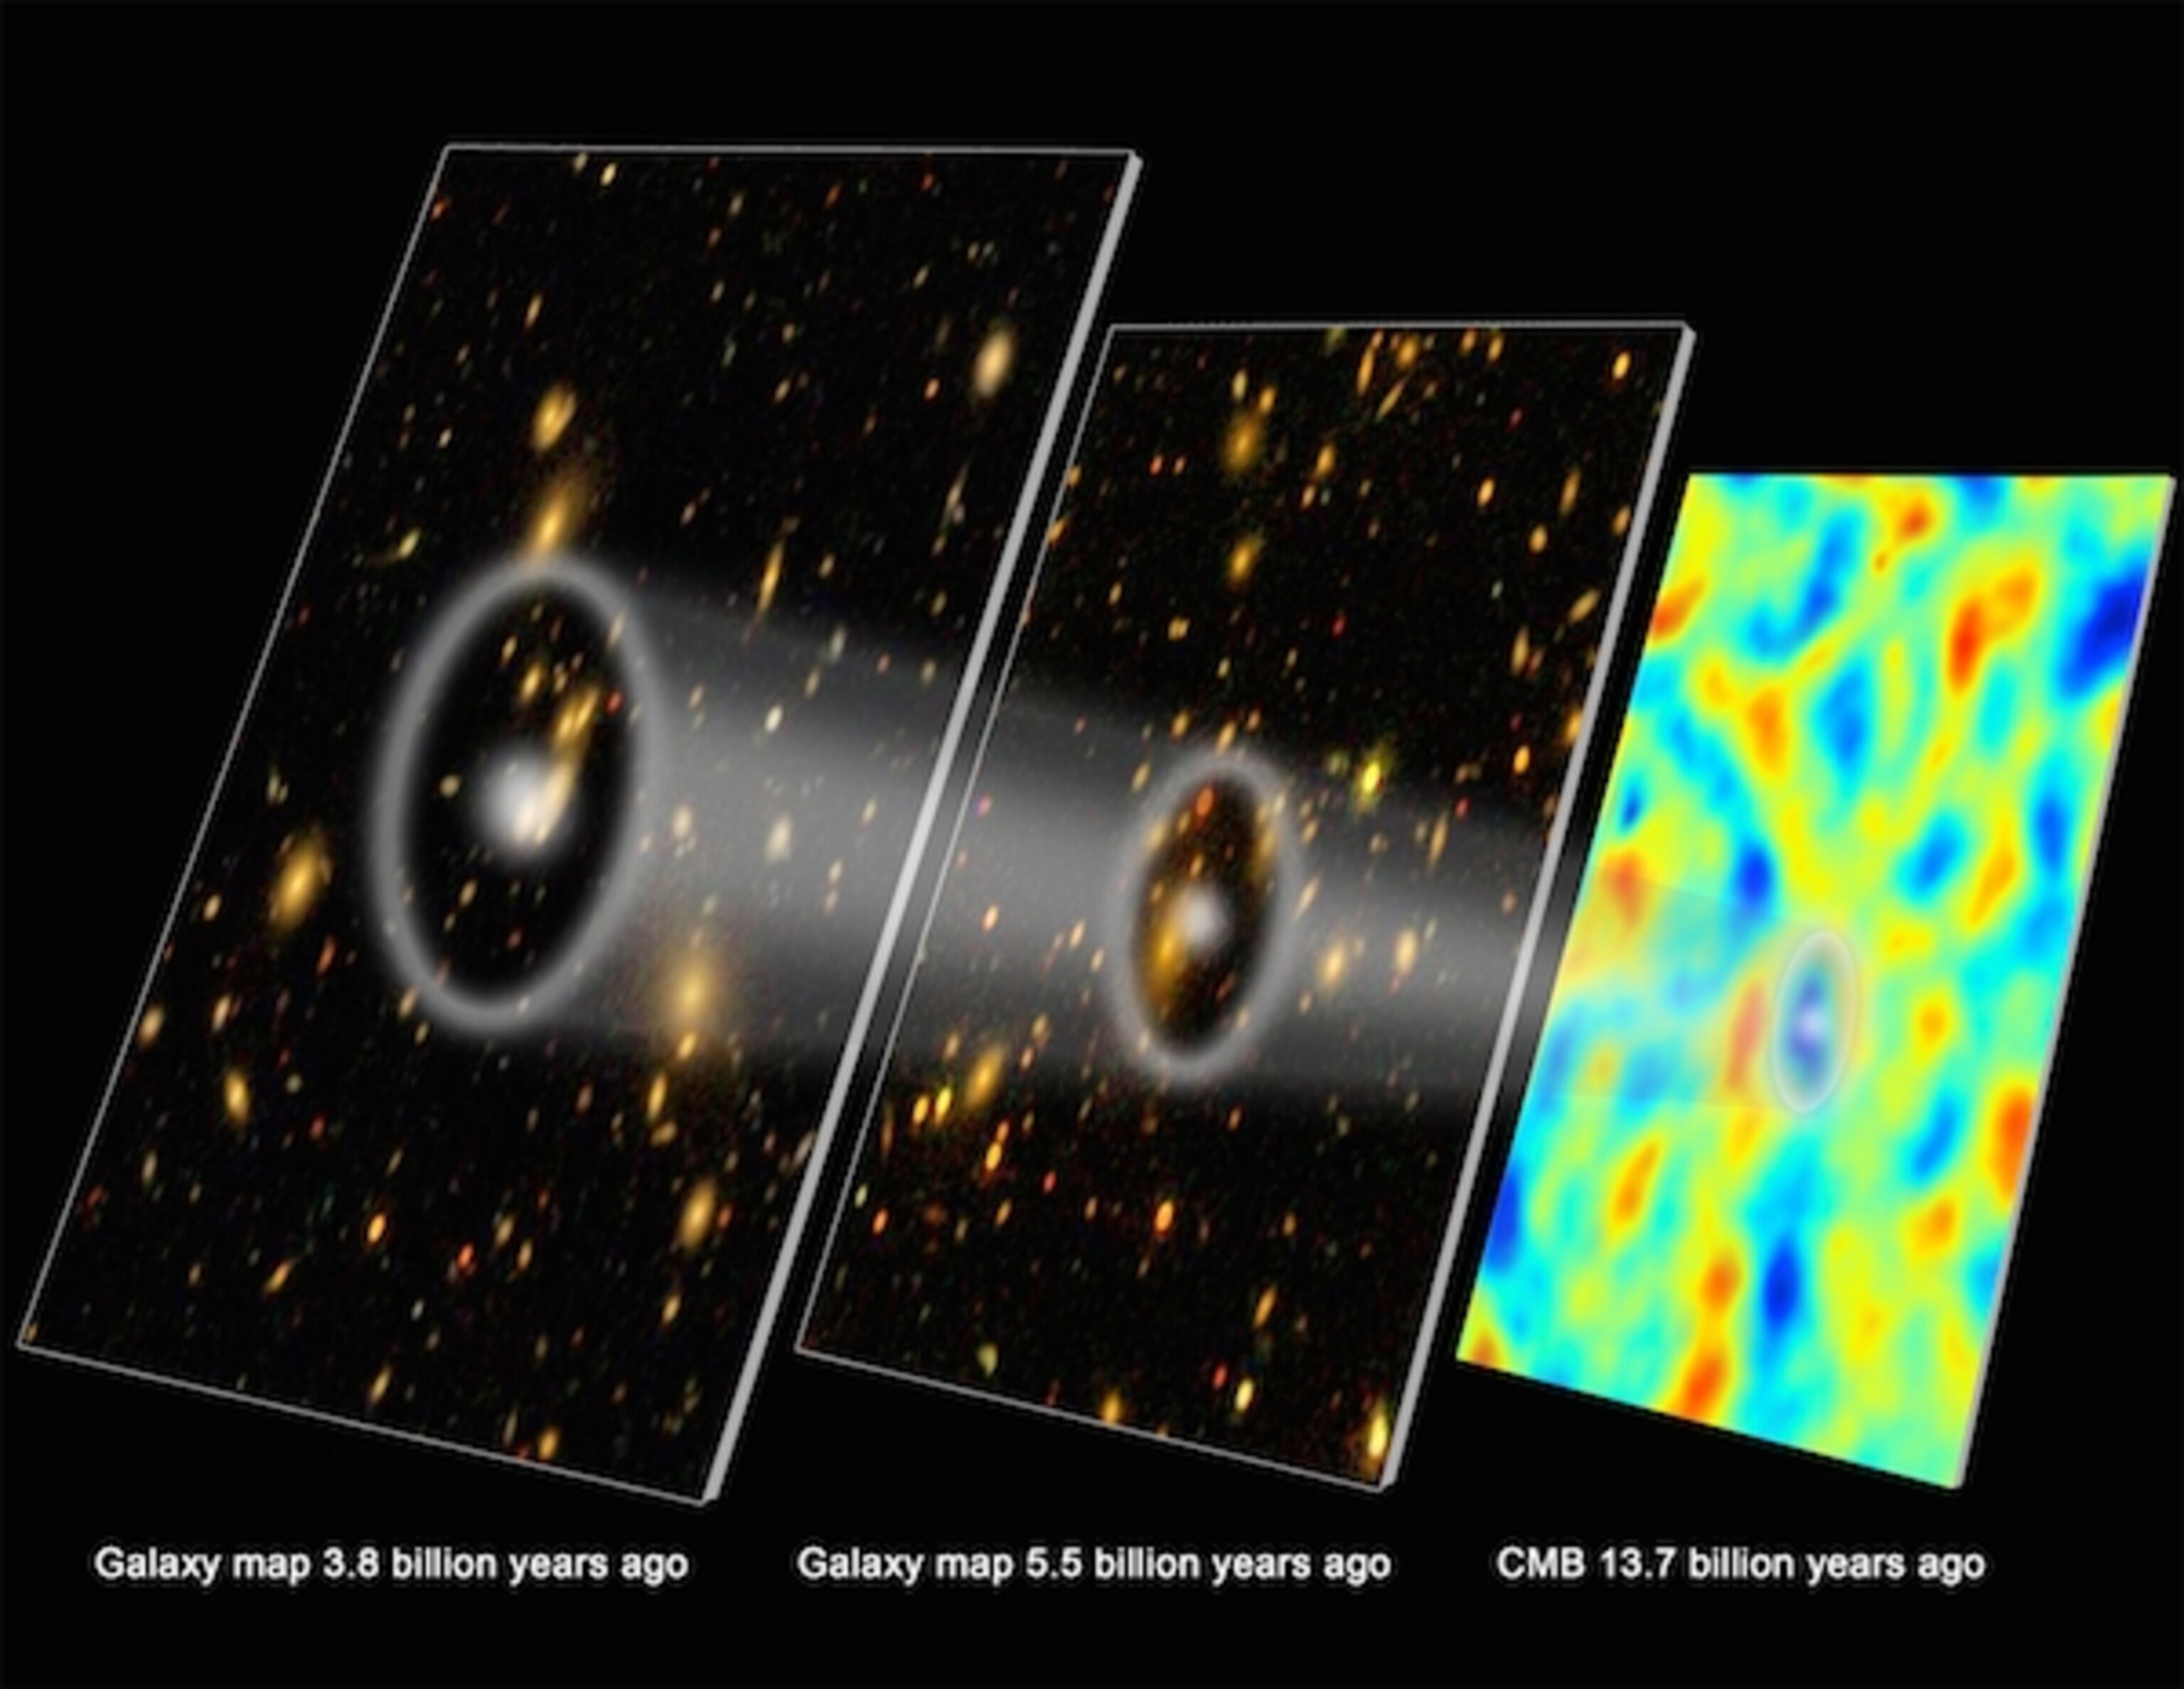
We can look arbitrarily far back in the Universe if our telescopes allow, and the clustering of galaxies should reveal a specific distance scale – the acoustic scale – that should evolve with time in a particular fashion, just as the acoustic “peaks and valleys” in the cosmic microwave background reveal this scale as well. The evolution of this scale, over time, is an early relic that reveals a low expansion rate of ~67 km/s/Mpc, and is consistent from CMB features to BAO features.
Distance ladder methods — measuring successively more distant objects — generate 73 km/s/Mpc.

The construction of a cosmic distance ladder begins with measuring the parallax of individual stars within the Milky Way and its satellites, such as Cepheids. Then we identify those same stars in nearby galaxies that also house other measurable distance indicators, such as type Ia supernovae, which we then observe at cosmological distances. This allows us to measure the expansion rate of the Universe by starting locally and looking out into the broader Universe.
Some argue the distance ladder could be biased.

This graph shows how various selection choices for the sample used in your distance ladder impacts both the average values (data points) and the uncertainties (size of the error bar lines) for a variety of galaxies. Some have JWST data and some have only Hubble data; some have Cepheids and some have asymptotic giant branch stars; some were selected by the CCHP team and some were selected by the SH0ES team, etc. The smallest uncertainties come from studies that use the full suite of data. The Planck data remains with a best-fit estimate of ~67 km/s/Mpc.
Could a single bad measurement, or calibration error, explain this tension fully?

This graph of astronomical magnitude (y-axis) versus Cepheid period (x-axis) for Cepheid variable stars in the Large (left) and Small (right) Magellanic Clouds. The stars are shown in two Weisenheit indices (top) and three Hubble filters (bottom) for each one. Once outliers (small x symbols) are excluded, the period-luminosity relations (solid lines) are derived.
To test this, astronomers assembled the Local Distance Network.

In this outline of a pipeline to measuring the Hubble constant (the expansion rate of the Universe today), astronomers from the Local Distance Network super-collaboration point out a series of pathways that leverage several independent methods at every step. If all methods converge on the same answer, then no single error in measurement or calibration could be responsible for the tension.
They leveraged many independent measurement techniques, testing for any such errors.

This graphic shows which galaxies that are used as anchors and contain both type Ia supernovae and Cepheids have been imaged by Hubble and JWST, respectively. You can see the change in each galaxy’s contribution to the value of the expansion rate today, H0, by including or excluding each galaxy within the full sample.
Instead of the traditional “parallax → cepheid → type Ia supernova” pipeline, many alternatives are considered.
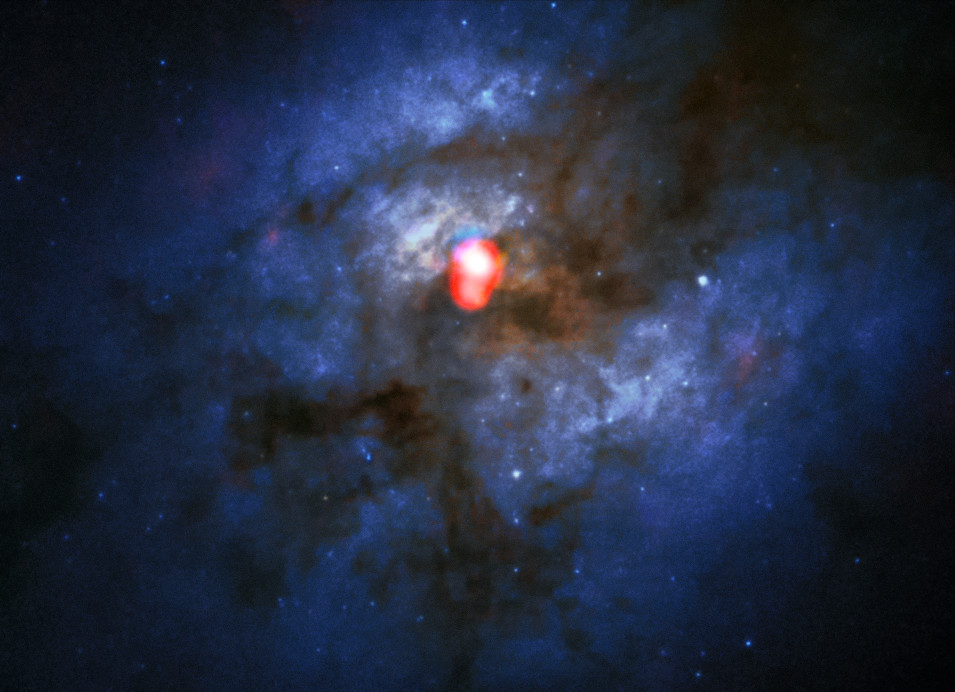
This composite Hubble (blue/white/dark) and ALMA (red) image shows not only the colliding galaxy system Arp 220, but also the double nucleus which contains the bright emission from both water and hydroxyl megamasers. Astrophysical masers rely on the same underlying physics as lasers, but were actually discovered prior to the 1958 invention of lasers in a laboratory.
One can begin with astrophysical masers,

Binary systems typically have unequal masses, unequal brightnesses, and orbit a barycenter that lies outside of both stars. Only if the alignment with respect to us is sufficiently edge-on, at right, will it appear as an eclipsing binary. Wide binaries, with separations of thousands of astronomical units (AUs), are exceptionally difficult to characterize. Approximately 35% of all stars are found in binary systems, with half in singlet systems and the remainder in trinary or even richer multi-star systems.
detached eclipsing binaries,
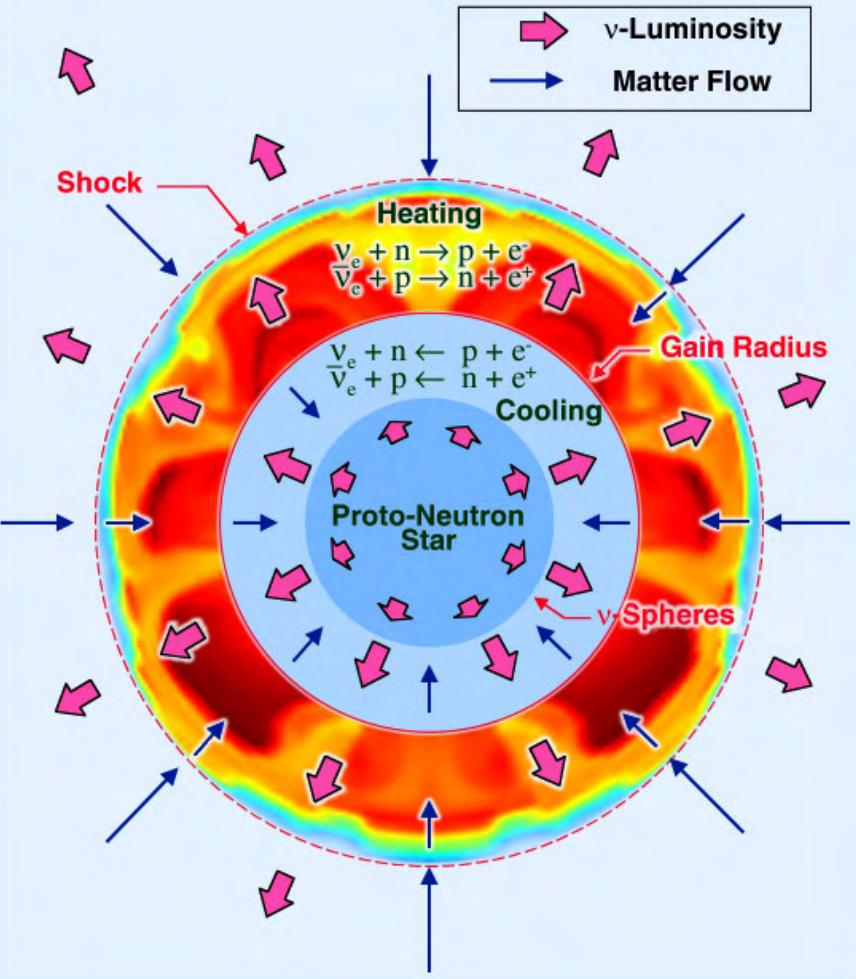
In the inner regions of a star that undergoes a core-collapse supernova, a neutron star begins to form in the core, while the outer layers crash against it and undergo their own runaway fusion reactions. Neutrons, neutrinos, radiation, and extraordinary amounts of energy are produced, with neutrinos and antineutrinos carrying the majority of the core-collapse supernova’s energy away. Whether the remnant becomes a neutron star or black hole, ultimately, depends on how much mass remains in the core during this process.
or type II supernovae,

The stars that are closest to Earth will appear to shift periodically with respect to the more distant stars as the Earth moves through space in orbit around the Sun. Before the heliocentric model was established, we weren’t looking for “shifts” with a ~300,000,000 kilometer baseline over the span of ~6 months, but rather a ~12,000 kilometer baseline over the span of one night: Earth’s diameter as it rotated on its axis. The distances to the stars are so great that it wasn’t until the 1830s that the first parallax, with a 300 million km baseline, was detected. Today, we’ve measured the parallax of over 1 billion stars with ESA’s Gaia mission.
not merely parallaxes.

When the actual data humanity has collected is applied to the various pipeline methods outlined by the Local Distance Network community, a variety of pathways to obtaining the Hubble constant, or the expansion rate today, are obtained. If all the results yield the same answer, then the idea that “one bad measurement” is responsible for the Hubble tension can be ruled out.
One can then progress to Mira variables,
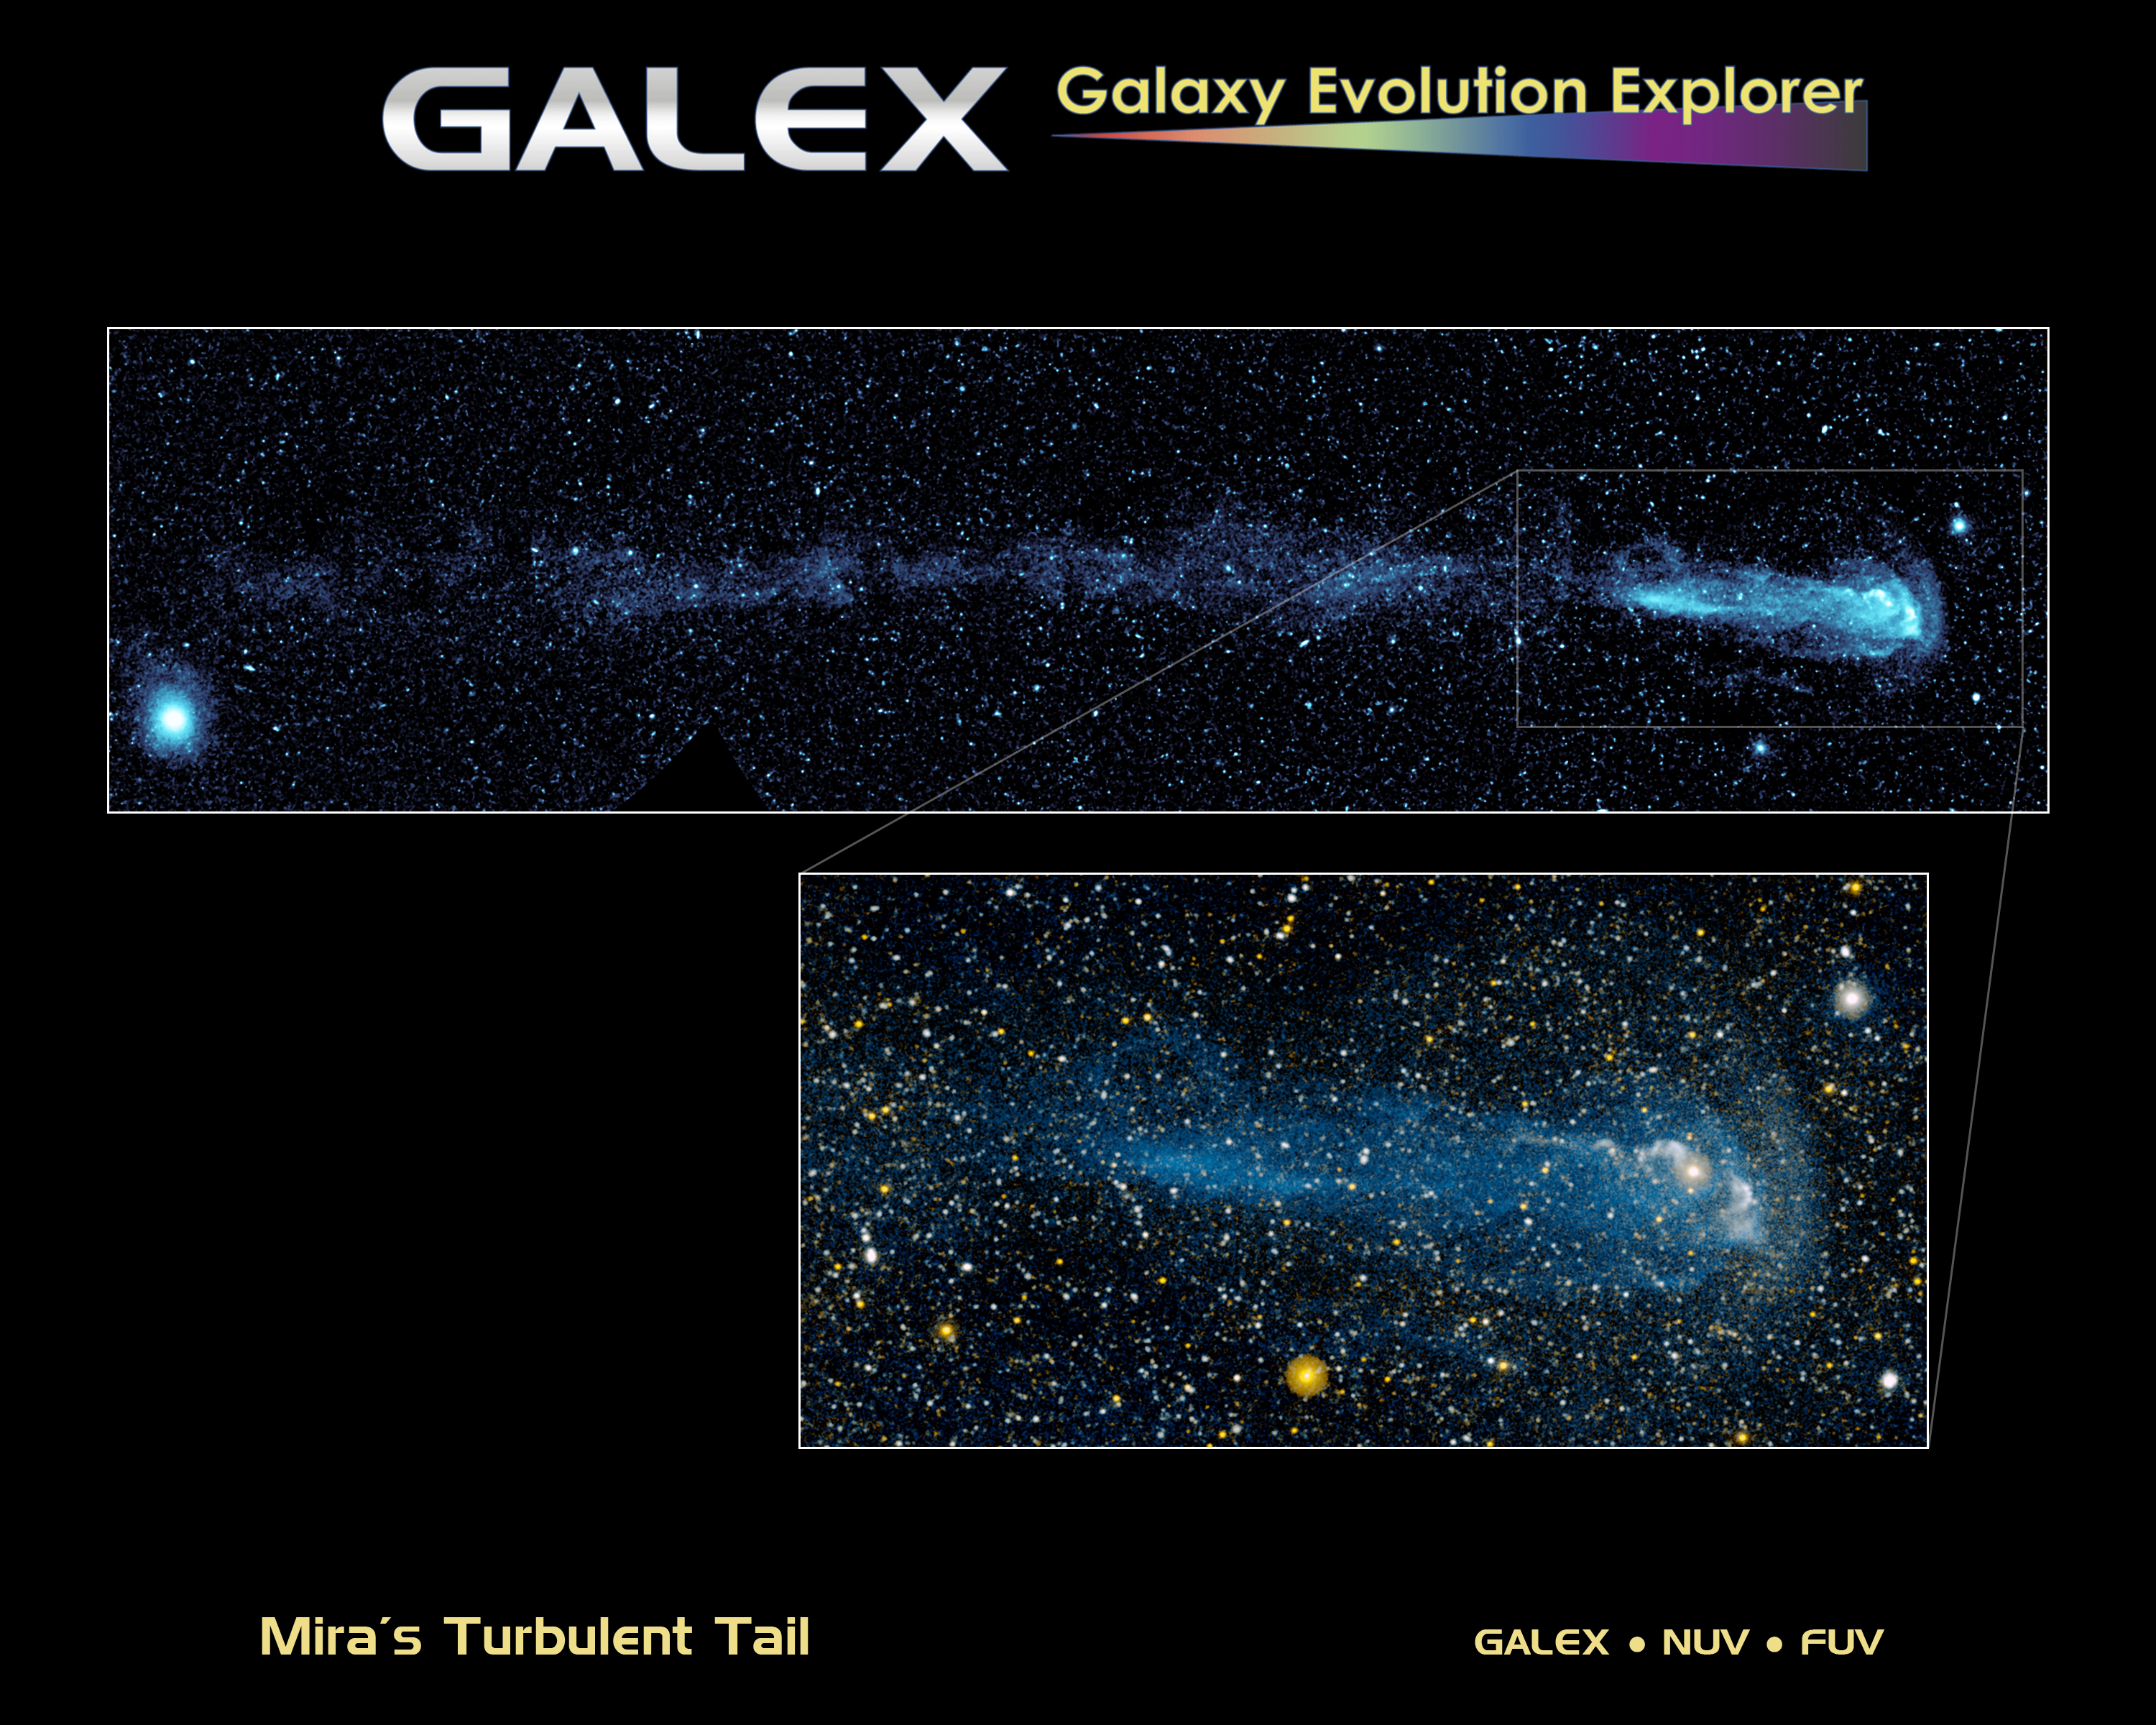
The star Mira, as shown here as imaged by the GALEX observatory in the ultraviolet, speeds through the interstellar medium at speeds much greater than normal: at about 130 km/s, which is about ten times faster than typical speeds but is still below the escape velocity of the Milky Way. Mira’s trajectory cannot be traced back to the galactic center, indicating that some lesser gravitational interaction gave it its high-velocity kick. Many stars other than Mira, however, have achieved speeds sufficient to gravitationally unbind them from our home galaxy, with a significant fraction of those being traceable back to the galactic center.
stars at the tip of the red giant branch,

When stars run out of hydrogen in their cores, they evolve off of the main sequence, becoming subgiants, then red giants, then igniting helium in their cores (which is the tip-of-the-red-giant branch phase), and then evolving onto the horizontal branch and eventually into supergiants (for high-mass stars) or into the asymptotic giant branch (for non-high-mass stars) before dying. The mass of a star determines its ultimate fate, but the rate of fusion is set by other internal properties.
or asymptotic giant branch stars,

The Variable Star RS Puppis, with its light echoes shining through the interstellar clouds. Variable stars come in many varieties; one of them, Cepheid variables, can be measured both within our own galaxy and in galaxies up to 50–60 million light years away, with all Cepheid variables exhibiting a relationship between their period, or how long it takes them to reach maximum brightness again after fading, and their luminosity, or how intrinsically bright they are.

An enormous variety of methods can be used to determine the distance to a host galaxy, several of which are illustrated here: Cepheid and tip of the red giant branch measurements to a variety of galaxies with a variety of telescopes. The uncertainty translates into no more than a 0.04 residual in the distance modulus to any such galaxy, illustrating the smallness of the uncertainty.
And then, one can measure surface brightness fluctuations,

Around galaxy UGC 00180, a great stellar halo consisting of approximately four billion stars’ worth of matter can be discovered by optimizing this telescopic image for low surface-brightness features. When a galaxy is observed with a realistic instrument, its surface brightness will exhibit fluctuations whose magnitude and frequency is dependent not just on the intrinsic properties of the galaxies itself, but also on its distance from us, enabling astronomers to use surface brightness fluctuations to measure cosmic distance.
Credit: Gran Telescopio Canarias (GTC) / Gabriel Pérez (IAC)
galactic rotation/velocity dispersion properties,

This animation shows the transition between ESO VISTA data (orange) and ALMA data (blue, white, and red), where the latter shows the velocity profile of what VISTA clearly shows is a disk galaxy. This makes REBELS-25, the galaxy imaged here, the earliest, youngest rotating disk galaxy ever discovered: just 700 million years after the Big Bang.
or type II supernovae,

Back sometime between 1667 and 1680, a core-collapse supernova occurred in the constellation of Cassiopeia, between 9000 and 11000 light-years away. First detected in 1947 in radio light, this VLA image maps out the radio emission coming from this supernova remnant.
not exclusively type Ia supernovae.

The beautiful barred spiral galaxy NGC 1015, shown here as imaged by the Hubble Space Telescope in 2013, also contains many Cepheid variable stars as well as an observed, recent Type Ia supernova. This information is used to calibrate the luminosity of the more distant Type Ia supernovae that cannot be measured alongside resolvable Cepheids. A large number of “connecting” galaxies that have both stellar-type and extragalactic-type indicators in them are needed to solidify the distance ladder.
The results average to 73.5 km/s/Mpc, with just 1.1% uncertainties.

Regardless of the direct (distance ladder) method used, the results obtained are all exclusively between 72 and 75 km/s/Mpc, with the lone exceptions coming from the CCHP group, whose calibration schemes have been repeatedly questioned and, when independently reanalyzed, brought into alignment with the other results. Note that even though the error bars can be larger with alternative methods, the mean value does not change.
Excluding any one method, indicator, or calibration produces no change.

If you insist on the assertion that there’s a single bad method or calibration that’s to blame for the Hubble tension, then the cross-check method of “leaving one out,” whether it’s a distance indicator or a type of measurement method, would reveal a bias in the conclusion. The lack of a meaningful shift in the above analysis is sufficient to rule such a culprit out.
The tension persists. “One bad measurement” cannot be the culprit.

If you measure the expansion rate of the Universe using an early relic method, like the light from the CMB (top right), you get a value of around 67 km/s/Mpc. If you measure it by constructing a distance ladder (below left), such as with Cepheids and type Ia supernovae, you get a value more like 73 km/s/Mpc. This discrepancy is at the root of the Hubble tension.
Mostly Mute Monday tells an astronomical story in images, visuals, and no more than 200 words.
Monthly Issue March 2026
The Roots of Resilience
In this monthly issue, we look at resilience not as a buzzword or a self-help prescription, but as a property — one that shows up, or doesn’t, at every scale.
2 videos 14 articles